











APRA’s latest National Claims and Policies Database (NCPD) release provides an early view of how professional indemnity and public liability premiums are shifting across the Australian market. Our initial analysis points to five key movements insurers, brokers and insureds should be watching.
The National Claims and Policies Database (NCPD) provides one of the most comprehensive views of professional indemnity and public liability insurance experience in Australia, drawing on policy and claims data from APRA-regulated general insurers.

In this article, we focus on premium movements across the latest policy data. Because gross written premium for an underwriting year continues to develop over subsequent reporting periods, we have projected ultimate premiums for recent underwriting years based on the average development observed in the historical data. As a result, the figures shown may differ from the raw numbers extracted from the database.
With that context in mind, five movements stand out from our initial review.
1. Lloyds market share has been stable over the last three years at 10% for PL and 16% for PI. This followed a period of growth, where they doubled their share of the PL market from 5% in 2020 to 10% in 2024. For PI, they grew from 10% in 2017 to 16% in 2024.
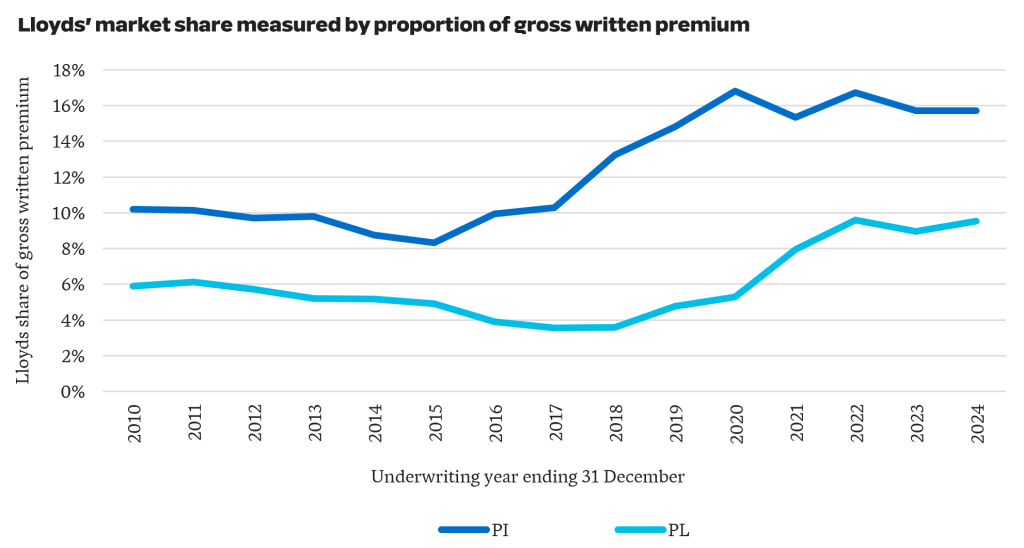
These numbers are consistent with Lloyds increasing their capacity in Australia. While Lloyds’ market share has remained relatively stable from 2022 to 2024, the greater competition in the Australian market has placed pressure on rates.
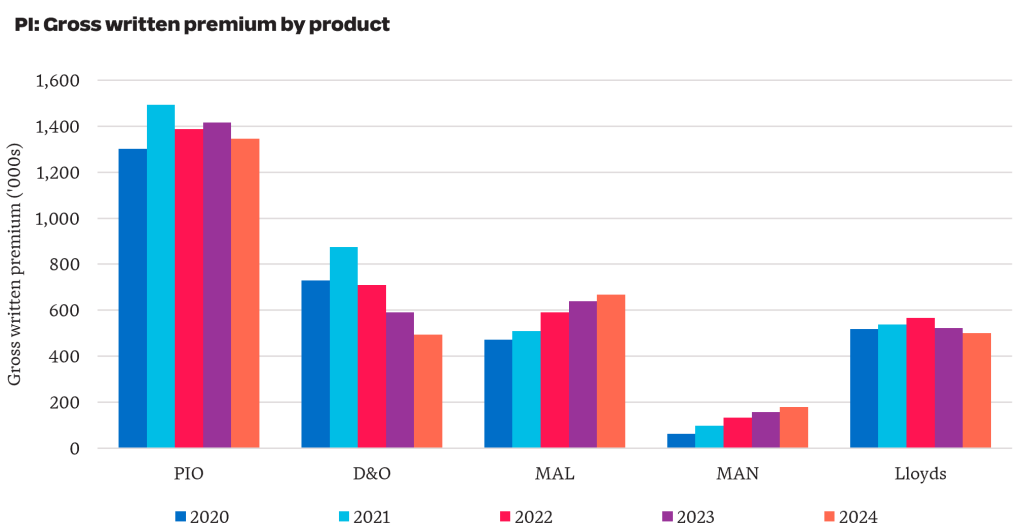
2. The PI market is soft in aggregate, recording a 4% reduction in GWP from 2023 to 2024. However, the story varies by product, with a 16% reduction for D&O and a 14% increase over the year for management liability.
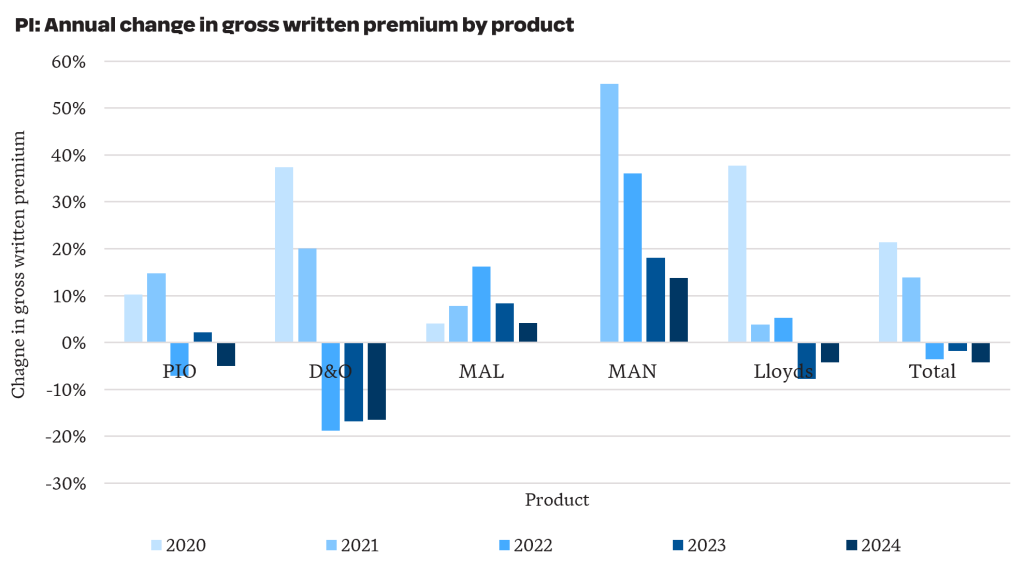
Total PI GWP including APRA-regulated and Lloyds reduced from $3.30 billion in 2023 to $3.19 billion in 2024 (-4%). More recent industry data shows this downward rate pressure has continued into 2025 and 2026.
For business written by APRA-regulated insurers, D&O written premiums reduced by over 40% from $874 million to $493 million since 2021. PIO accounts for 50% of the PI premium written by APRA-regulated insurers and has reduced by 10% from $1.49 billion in 2021 to $1.35 billion in 2024.
3. Engineering and financial occupation PI premiums have moderated from COVID-era highs.
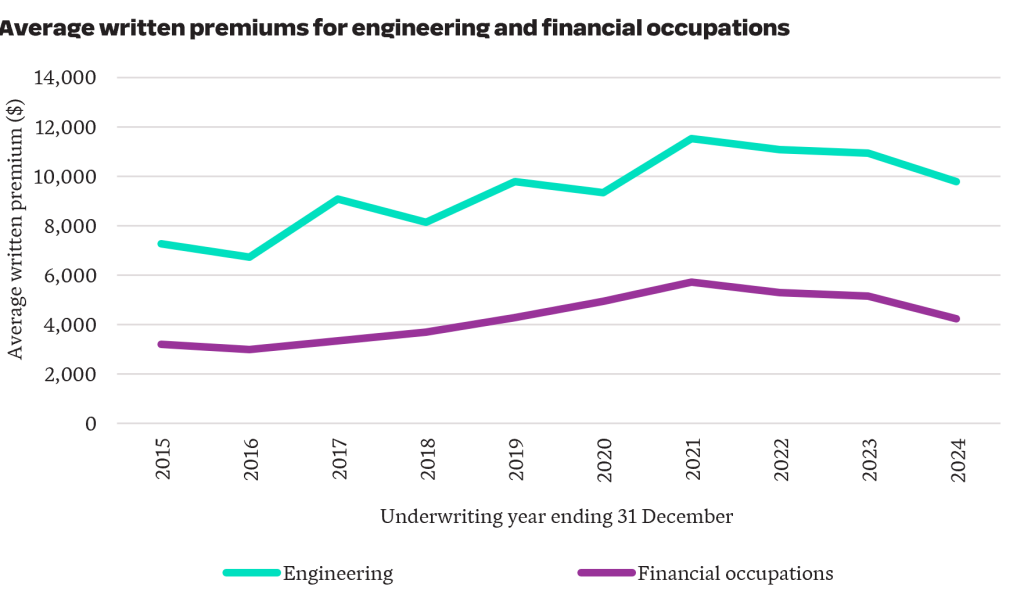
Engineering and financial occupations account for 48% of PIO written premiums. Both professions experienced notable premium increases during the COVID-era, in part reflecting heightened concerns around building defects and combustible cladding for engineers, and the impacts of the 2019 Financial Services Royal Commission for financial occupations.
The latest data suggests conditions have since eased. The engineering profession experienced a 15% reduction in average written premiums, while financial occupations saw a 26% reduction.
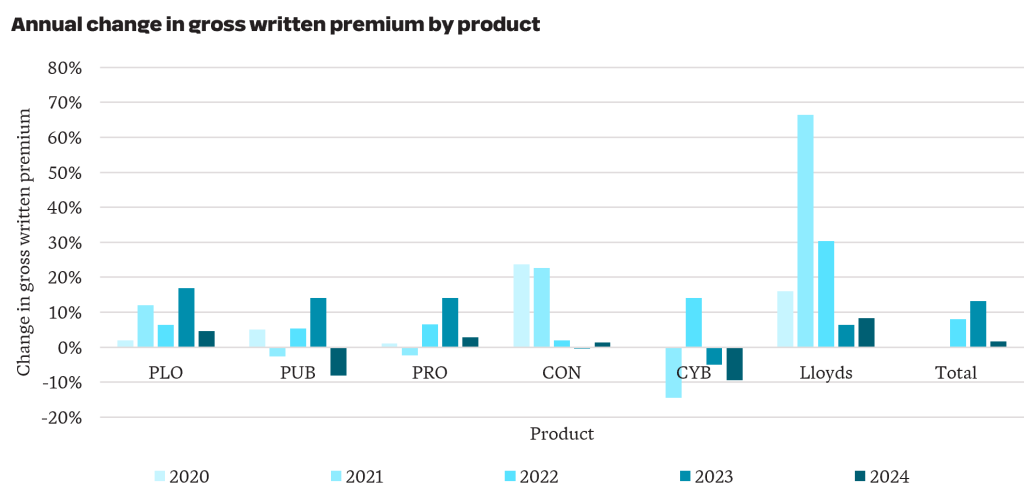
4. GWP increased by 2% from $3.7 billion in 2023 to $3.8 billion in 2024 for public liability. Results by product were mixed, with Public Liability Other (PLO) increasing by 5% and Cyber reducing by 9%
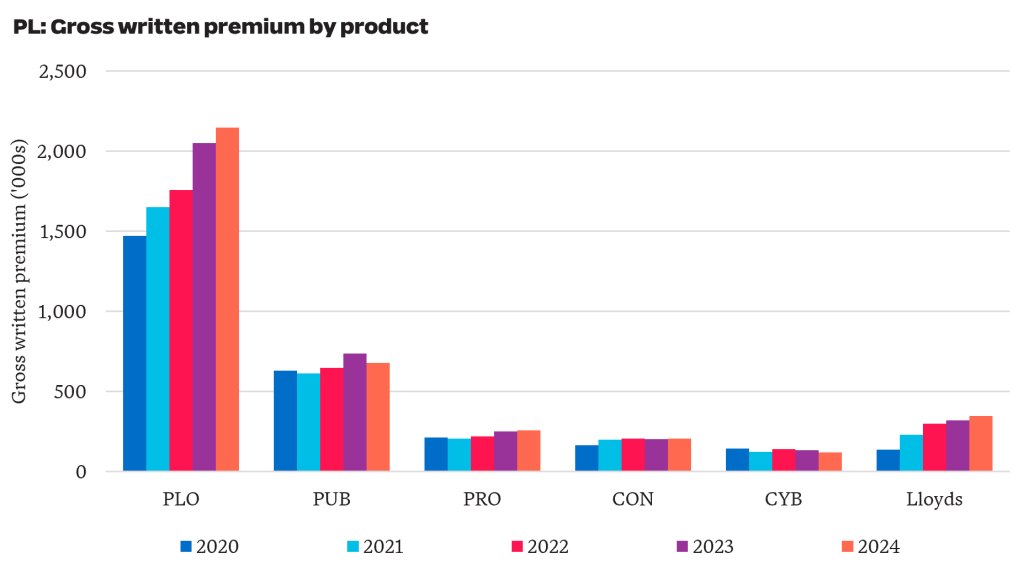
For business written by APRA-regulated insurers, PLO GWP increased by 46% from $1.5 billion in 2020 to $2.1 billion in 2024 (see chart below). This is on top of a 32% increase in GWP seen over the five years prior. Taken together, GWP nearly doubled between 2015 and 2024. Average premiums have increased materially, driven by increased pressure from worker-to-worker claims, higher legal and litigation expenses and an increase in psychological injuries.
More recent industry data suggests premiums have started to stabilise in some sectors of the PL market.
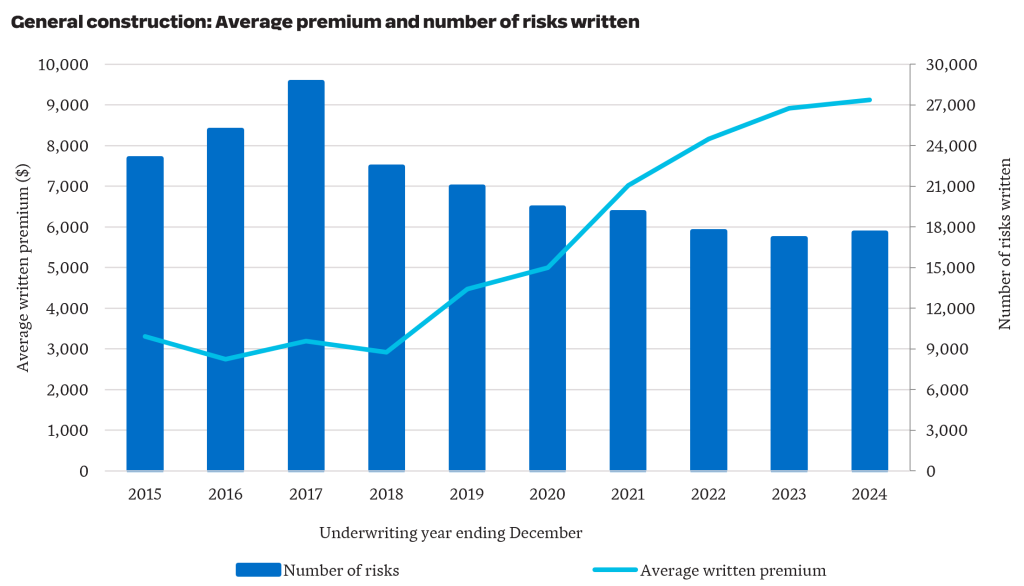
5. Affordability pressures are evident in the construction sector, with average PL premiums tripling in six years.
The recent Parliamentary Inquiry into insurance premiums for small businesses has placed affordability under the spotlight. The construction industry was one of the sectors called out for facing increasing insurance costs.
For General Construction business underwritten by APRA-regulated insurers, average written premium tripled from around $3,000 to over $9,000 in the six years from 2018 to 2024. Over the same period, the number of risks written has reduced by 22% from 22,500 to 17,500.
APRA’s latest NCPD data points to a liability market that is not moving in one direction. Our initial review highlights areas where premiums appear to be easing, particularly across parts of professional indemnity, alongside sectors where affordability pressures remain acute. As the claims data is examined in more detail, the next question is whether these movements reflect short-term market adjustment or a more sustained shift in risk appetite, capacity and claims expectations.
What is the NCPD?
The National Claims and Policies Database (NCPD) contains data on every policy and claim underwritten by APRA-regulated general insurers since 2003. Business placed with Lloyds is covered in a separate database and is only available at a whole-of-product level.
For Professional Indemnity, the NCPD covers Directors and Officers’ liability (D&O), Medical Indemnity/Malpractice (MAL), Management Liability (MAN) and Professional Indemnity Other (PIO).
For Public Liability, the NCPD covers pure Public Liability (PUB), pure Products Liability and Product Recall (PRO), Construction Liability (CON), Cyber Insurance (CYB) and Public Liability Other (PLO).
Want more analysis on NCPD data?
We’ll shortly share more insights on APRA’s latest NCPD release as we analyse the latest claims experience.